Career Research Completion, Multimedia and Databases
| p7nardellal5212charts.xlsx |
Charts for Career Exploration
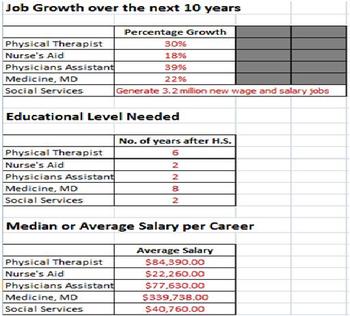
This assignment is called Charts. These there charts the final results for the career exploration completion. This assignment consists of three charts that have the job growth over the next 10 years, education level needed, and the median or average salary per career. I chose five of my top career choices to collect this data for. These career choices included a physical therapist, nurses' aid, physician's assistant, medicine, MD, and social services. The technology skills I had to use to complete this assignment included making charts and entering data I previously found from my job careers. I needed to find the data from the steps I took before the charts and enter each of the headings in. These charts helped me learn how to organize my information more effectively and it was beneficial to me and my career decisions. I am now able to narrow down the decisions I have made for my career. Also, I can choose which career has the best job growth over the next 10 years, the educational level needed is enough and sufficient, and the average salary is beneficial to me. I believe what I did well in this assignment was the breaking down of each job career and selecting the few that I was mostly interested in. I believe I chose the best careers for me and I am now able to compare the data and choose my pathway into the future. I completed everything I needed to complete in this assignment but if I wanted to go further with my work, I would change the chart to look more appealing. I would add some color and apply more skills I learned from using Microsoft Excel.
